Making News


Stand Up for Free Enterprise
Join us in supporting American free enterprise.
Your voice is essential, and your participation is critical.
Free Enterprise Works


- Small Business
Small Business Outlook: Confidence in Economy Drifts Up
By Thomas M. Sullivan


- Small Business
Small Businesses Think Cyberattacks Are Biggest Threat, Survey ShowsThe Q1 2024 Small Business Index remained steady, and small businesses shared their sentiments about disaster preparedness and recovery.
By Thaddeus Swanek


About Us
In 2023, the Chamber shaped pro-business outcomes for the most immediate issues at hand while also advancing debates around the topics that will determine our nation’s competitiveness for years to come.
More Headlines

- Technology
Maximizing Cost Savings: Unleashing the Value of Federal IT ModernizationWhy federal IT spending is a core strategic investment for every federal agency.

- Employment Policy
What You Should Know About the UAW
By Glenn Spencer - Workforce
What Will the Workplace of the Future Look Like?
By Stephanie Ferguson


We believe in the power of business to improve society and create a brighter future for people, communities, and our country.
Major Initiatives
- Americans Deserve a Transparent and Accountable FTCThe Federal Trade Commission’s (FTC) recent actions are alarming and pose a serious threat to our economy.Learn More
- America Works InitiativeWe are calling on elected officials and the federal and state level to take immediate action to help address this national economic crisis.Learn More
- Equality of Opportunity InitiativeThe EOI agenda advances real solutions through private sector initiatives, and policy advocacy at the federal, state, and local levels.Learn More
- Protect Main Street LendingStand with us to ensure your local businesses can access the resources they need to thrive.Learn More


We Work for You
The U.S. Chamber of Commerce is the world’s largest business organization and network. Our members range from small businesses and chambers of commerce across the country to startups in fast-growing industries, leading industry associations, and global corporations.
For all the businesses and associations we represent, we are the only organization that optimizes the relationship between government and business at scale, across the economy, and around the world.

Join the largest community of business leaders in the world. Together, we'll work for government policies that help you run and grow your business, eliminate bureaucratic barriers, and strengthen America’s economy. You'll also gain access to the latest intelligence on issues shaping the nation, premier events for entrepreneurs, and webinars, guides, and other resources to help you grow your business.
Upcoming Events
- Small BusinessCO— Small Business DayWednesday, May 0112:00 PM EDT - 02:00 PM EDTLearn More
- Security and Resilience13th Annual Building Resilience ConferenceWednesday, May 15 - Friday, May 1708:00 AM EDT - 03:00 PM EDTLearn More
- Environment and Sustainability2024 Sustainability and Circular Economy SummitTuesday, June 0408:30 AM EDT - 01:30 PM EDTLearn More
Trending Topics
- TechnologyInformation and news for businesses about the latest advances in technology.Learn More
- WorkforceInformation on how businesses can adapt their workforce development and management strategies to deal with the changing labor market.Learn More
- Supply ChainInformation and news about the latest developments in the global supply chain.Learn More


Latest Content
U.S. Chamber statement on the Federal Trade Commission’s (FTC) final vote to ban employer noncompete agreements and litigation response.
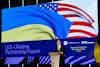
The 2024 U.S.-Ukraine Partnership Forum explored public and private sector opportunities to support economic development and recovery in Ukraine.
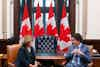
Workers at a Chattanooga Volkswagen plant voted for UAW representation last week, even though prior UAW representation ended in a plant closure.
The U.S. Chamber of Commerce announced its endorsement of Jefferson Shreve to represent Indiana’s Sixth Congressional District.
The Sustainability and Circular Economy Summit on June 4 will bring together government and business leaders to detail the crucial role business plays.
The U.S. Chamber challenges the Biden Administration's stonewalling of FOIA requests on "march-in rights" to find out how the plan to confiscate IP of businesses was made.
The Biden administration’s withdrawal of support for important digital trade rules continues to undermine U.S. industry.
Chamber members are building critical digital infrastructure in countries across Africa, transforming not only the way Africans live and work but also expanding trade and connectivity.